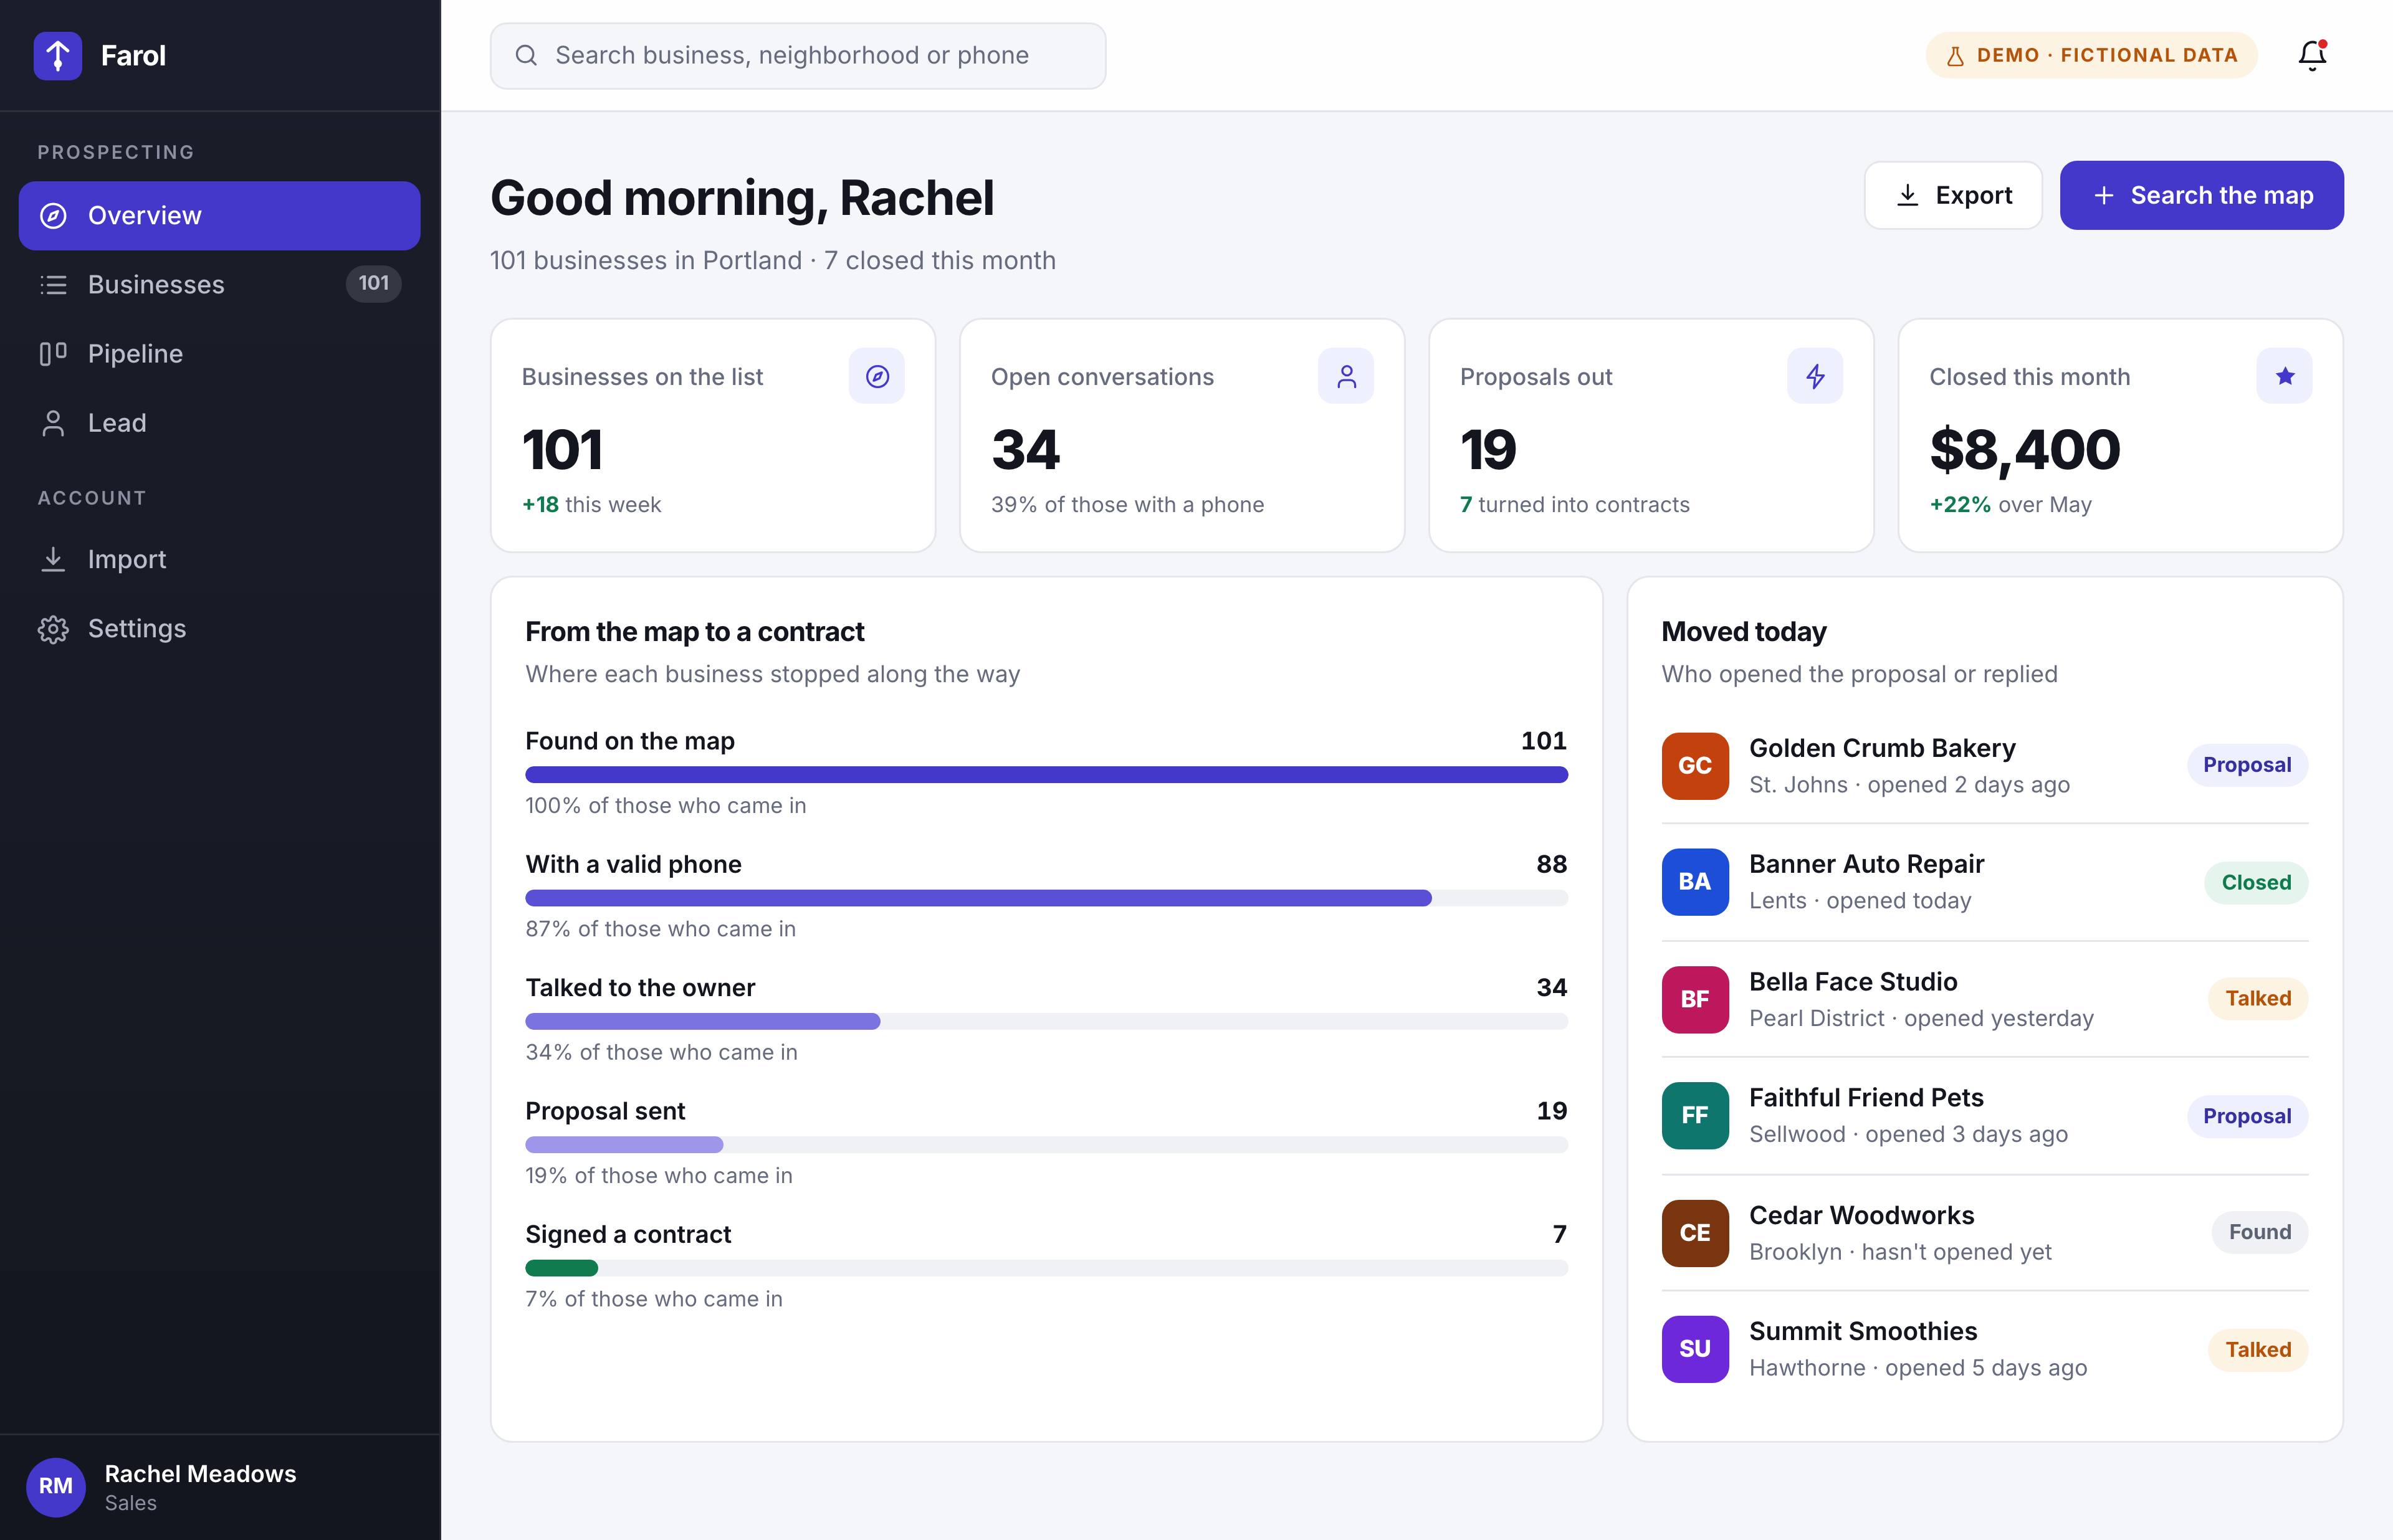
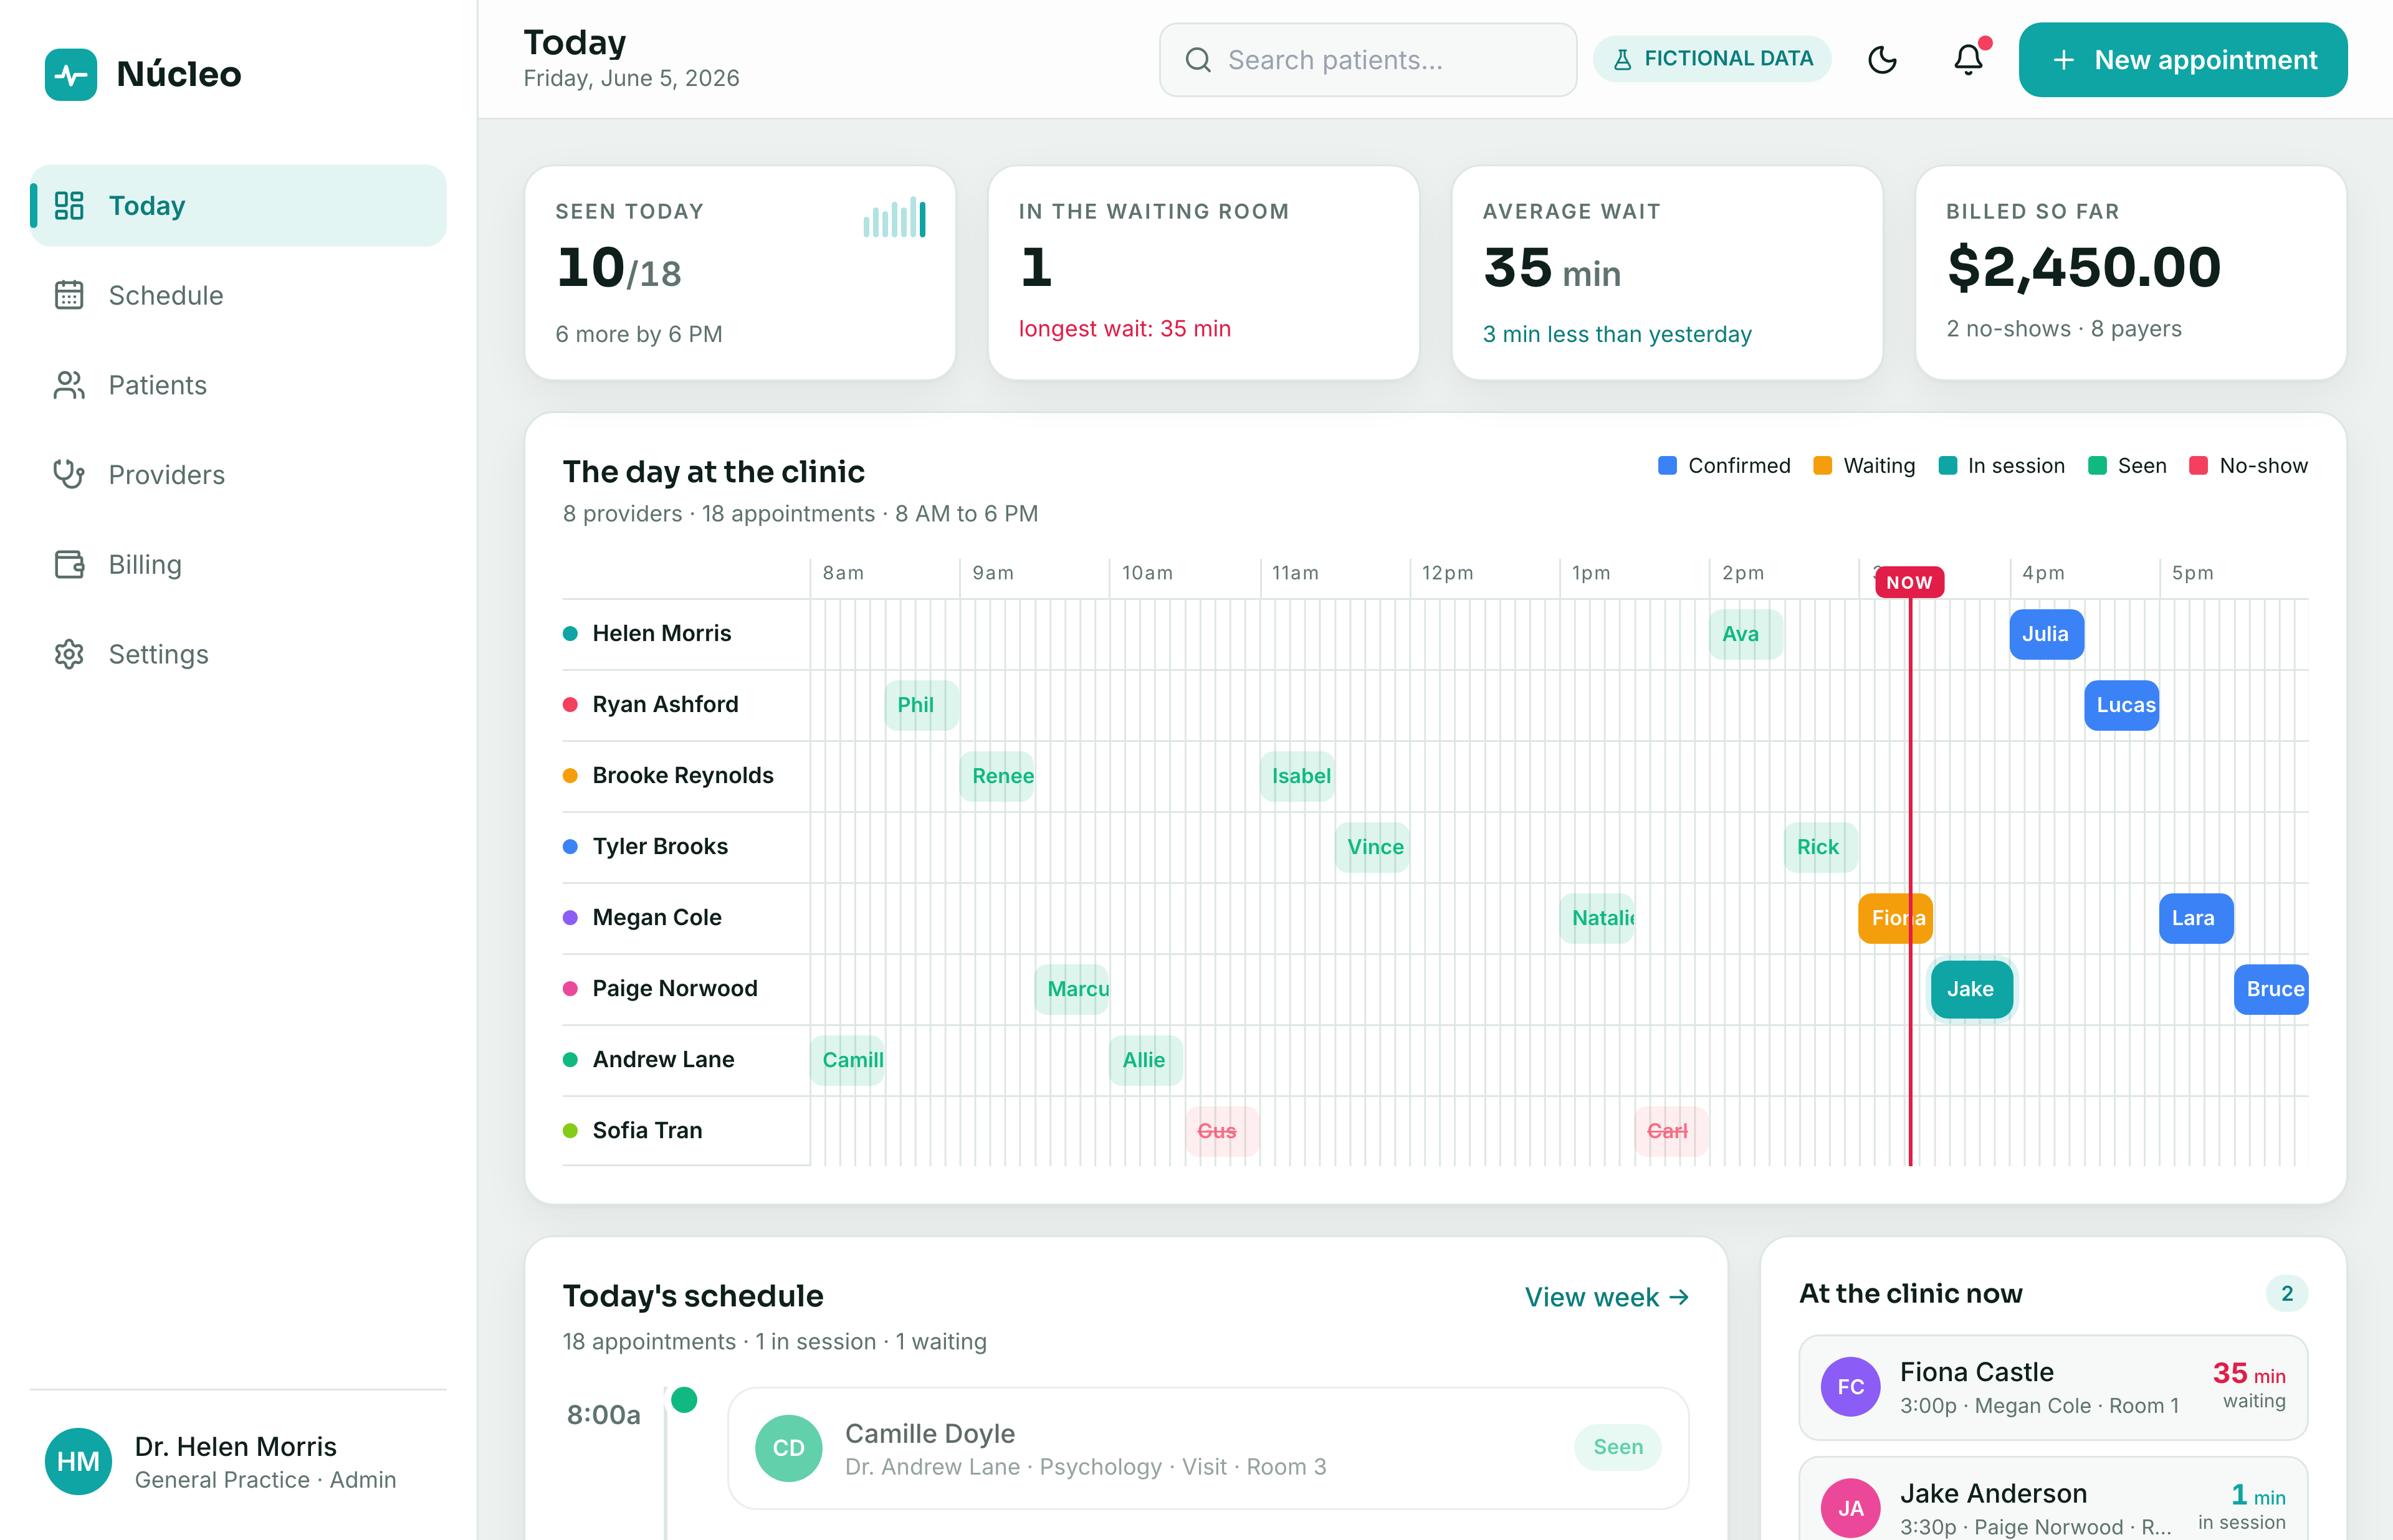
A multi-specialty clinic panel — the week's agenda by professional, the patient chart one click away, finance and the day's indicators. A self-initiated, navigable demo: eight professionals, real-time appointment status, a patient chart with history, and four management charts. The high-fidelity prototype that comes before the product.
01 / THE PROBLEM
Agenda in a notebook, records in a drawer.
A clinic with several professionals and different insurers has a classic problem: the front desk keeps the agenda in one place, the patient chart in another, and finance in a third. When a patient calls, no one sees at once the right doctor's agenda, the patient's insurer and their last visit.
The cost shows up as empty slots no one filled, follow-ups that never got booked, and revenue that slips. I wanted to show the whole clinic on one screen — agenda, patient and money in the same place — and built the demo for it.
02 / THE APPROACH
The agenda is the home screen, not a hidden menu.
The design call was to put the week at the center. You open the panel, see the six days and filter by professional in one click — eight doctors, each specialty with its own color. Each appointment carries a real status: confirmed, waiting, in session, seen, or no-show.
From the appointment block you open the patient chart in a side drawer — insurer, contact and recent-visit history — without changing screens, without losing your place in the agenda. That's how I solved the core pain: everything one click from the calendar.
03 / THE BUILD
Live status, side-drawer chart, management in four charts.
Agenda by professional, in color. Six columns (Monday to Saturday), a per-doctor filter and a specialty legend that paints the whole week. One glance and you read the clinic.
Patient chart without leaving the agenda. The record opens in a drawer with details, insurer and history — built for a front desk taking calls while it navigates.
Four management charts. Appointments for the week, split by specialty, the half-year's revenue (received vs. expected) and the insurer mix. Enough for the owner to understand the month without opening a report.
The demo runs entirely in the browser on fictional data. In production it leans on Next.js + Prisma + Postgres plus a calendar and payment integration — but the entire front-desk flow is already here.
04 / OUTCOME
The whole clinic in one link.
Instead of promising "a scheduling system," I send the demo and the person navigates their own routine: filter the doctor, open a chart, read the finances. Six screens, eight professionals, five live appointment statuses and four charts — in a single file, on phone or desktop.
It's the self-initiated piece that opens a conversation with a real clinic and makes scope clear before any production code.
Screens
6
Specialties
8
Live statuses
5
File
1 HTML